Tuesday, 29 May 2007

The Relationship between Variables (Part II)

This article is a continuation from Part I, which discusses about direct proportion.


Inverse Proportion

Two sets of readings for the quantities x and y are given in the table below.

x

3

4

6

12

y

4

3

2

1


Here, when x is doubled, y is halved; when x is trebled, y is one-third its previous value and so on.

We say that y is inversely proportional to x, or y varies inversely as x, that is

The graph of y versus x is as shown:
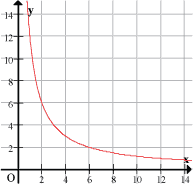
Notice that the product of x and y is the same for every point (12 in this case). Hence this product is known as the constant of proportionality or variation and it is given a symbol such as k. Therefore, we can write the exact relationship between x and y as

Assuming that there are points (x1, y1), (x2, y2), (x3, y3), …, we can say

xy = x1y1 = x2y2 = x3y3 … = k

Notes:
  1. When a variable is proportional to two or more variables, we can represent this relationship as a joint variation. For example,
    When
    y x and y ∝ z
    therefore
    y xz or y = kxz

    When

    therefore
  1. In every proportional relationship, the converse is also true. For example,
If y x, then x ∝ y.


Examples of physical quantities that vary inversely with each other are:
  • Pressure and volume
  • Frequency and periodic time
  • Gravitational force and the distance squared

To be continued…
Monday, 28 May 2007

Problem: Kinematics #3

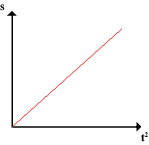
The figure above shows a displacement versus time squared (t2) graph for the motion of an object.
Which of the following motion can be represented by this graph?
A. A ball that is travelling at terminal velocity.
B. A ball that is falling freely from a stationary position.
C. A ball that bounces back from the floor.
D. A ball that is travelling on a rough surface.

Solution

Show solution >>


Question source: Malaysia National Physics Competition Panel

Saturday, 26 May 2007

The Relationship between Variables (Part I)

One of the most important mathematical operations in physics is finding the relationship between variables. Through the study of these relationships, we can know how a change in one variable affects another variable, thus enabling us to make predictions and conclusions easily.

For example, an automobile maker will want to know how the mass of a car affects its acceleration, so that they can design cars with optimum performance.


Direct Proportion

Suppose that in an experiment four sets of readings are obtained for the quantities of x, y, p and q as in the tables below.

x

1

2

3

4

y

1

2

3

4

Table 1

p

1

2

3

4

q

3

6

9

12


Table 2


In Table 1, we see that when x is doubled, y doubles; when is x trebled, y trebles; when x is halved, y halves and so on.

Similarly in Table 2, when p is doubled, q doubles; when p is trebled, q trebles; when p is halved, q halves and so on.

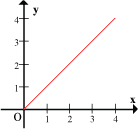
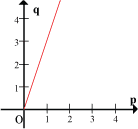
Now, two graphs are plotted using the values in Table 1 and Table 2, as shown below:


Since both graphs are similar in the sense that they are straight line graphs passing through the origin, the relationship of x with y and p with q are somewhat similar. We say that both pairs of variables are directly proportional to each other or varies directly with each other. In symbols,
xy and pq

But there is a difference in gradient (slope) between the two graphs, as illustrated above. When we want to define the relationship between the two variables exactly, we have to take into account this difference. Because they are straight line graphs passing through the origin,

where x and y are the x and y values of any point on the graphs.

The constant obtained is called the constant of proportionality or variation and is given a symbol, such as k, so that the relation between y and x can be summed up by the equation


Therefore, we can conclude that the relationship between x and y in Table 1 is
y = x
(k = 1)

The relationship between p and q in Table 2 is
p = 3q
(k = 3)


Notes:
  1. The constant of proportionality defines how y increases with x. Every increase of 1 unit of x will result in k increase in y.
  2. In practice, because of inevitable experimental errors, the readings seldom show the relation so clearly as here.
  3. Assuming that there are points (x1, y1), (x2, y2), (x3, y3), … and x ∝ y, we can say
or y1 = kx1, y2 = kx2, y3 = kx3


Examples of physical quantities that vary directly with each other are:
  • Force and mass
  • Work done and force
  • Speed of wave and its frequency

>> Continue to Part II


Friday, 25 May 2007

Problem: Kinematics #2


The figure above shows two objects, P and Q moving with velocities 30 m s-1 and 20 m s-1 respectively towards each other on a straight line.
How long, after that instant, will P and Q meet?
A. 100.0 s
B. 83.3 s
C. 20.0 s
D. 13.3 s

Solution

Show solution >>


Question source: Malaysia National Physics Competition Panel

Friday, 11 May 2007

Problem: Materials #2

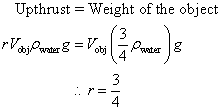
The density of an object is ¾ of the density of water. If the object is floating on the water surface, then the ratio between the volume of object above the water surface and the volume of object below the water surface is
A. 1:4
B. 1:3
C. 3:4
D. 4:3

Solution

Show solution >>


Question source: Malaysia National Physics Competition Panel

Saturday, 5 May 2007

Problem: Materials #1

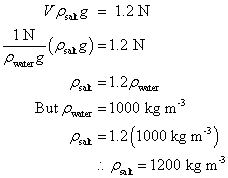
An object has a weight of 4 N in air, 3 N in water and 2.8 N in a salt solution. If the density of water is 1000 kg m-3, the density of the salt solution is
A. 830 kg m-3
B. 1070 kg m-3
C. 1200 kg m-3
D. 1430 kg m-3

Solution

Show solution >>


Question source: Malaysia National Physics Competition Panel